
I thought it might be interesting to share some stats/trends around https://msportals.io which currently uses Google Analytics. Most sites have a commercial aspect and don’t like to share this data, but as it’s purely community and no financial gain, let’s check out some stats:
Last 7 days from 31st May (Monday):

Last 28 days from 10th May:

Last 12 months:

All time – from October 2021 to June 2023.

Unsurprisingly, there is a constant peak/trough for weekdays and weekends. I’m not sure why it’s more evident over the ‘all time’ stats vs ‘last 12 months’, but ’28 days’ and ‘7 days’ show a good reflection of this. Those giant peaks on the ‘all time’ are from either a news article posting about the site, or someone having a very successful social media post bringing attention to msportals.io.
There is also a pretty steady user count between 1500 and 2000 a day, excluding weekends.
Where are users coming from? (last 90 days)
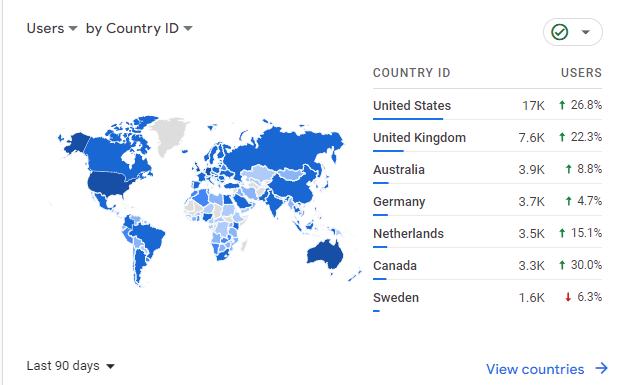

Another unsurprising statistic is that most users are coming from the US – UK is next, and probably more surprising is Australia being third – maybe because I have a wider audience and more connections here?
US is the first most common US city in 7th place, while London is 1st, which I’m sure matches the expected stats due to population distribution.
Which pages are most hit? (last 90 days)

Still more unsurprising stats, the main page accounts for the most hits, which contains the standard Microsoft Admin portals. Next up is the Government portals, which is only US Gov – so there is obviously fairly high usage of those; double the stats of the user page which I did think would be a bit more widespread – but I expect the waffle from office.com serves most users quite well.
How do users get to msportals.io? (last 90 days)

Most have the site bookmarked, or are typing the URL directly into their browser. The next most common is via search engine – testing via private browser mode, searching for ‘Microsoft Portals’ brings up msportals.io as the first result on both Bing and Google, but I can’t see any stats on what search terms refer people to my site the most.
Average Engagement Time (last 90 days)

If someone visits the main msportals.io site, the average engagement time is 36 seconds (based on the last 90 days). Most sites will want higher engagement times, but the point of this site is to get people to where they want to get to as quickly as possible, so I’m pretty happy with 36 seconds as an average. Other pages have similar times, although I have no idea how language conversion is happening, or why what I assume is the French language ‘Portails adminitraeur | Portails Microsoft’ has more than 2 minutes engagement time despite France not being in the top 7 countries (I’ll blame Canada – sorry).
Tech – Device, Platform (last 90 days)


These stats I find quite interesting. No surprise that Windows is vastly the main OS used to access msportals.io, with similar numbers of Macs vs iOS users, and slightly behind that, Android. There’s 90% desktop users vs 10% mobile users – rounding to nearest number and ignoring the 0.3% of tablet users.
Very similar browser stats on Edge vs Chrome (which compared to the stats for the sites’ entire life, Chrome has been used slightly over 2x as much as Edge, which shows Edge’s usage drastically increasing for at least my sites’ user base), and fair way behind are similar usage stats for Safari vs Firefox (and again comparing since the site launched, that’s been similar the whole way along with a tiny bit more Safari).
Screen resolutions I am happy to see the standard 1920 x 1080 being far ahead. Quad HD is second, with a bit of ultrawide 5th on the list. Again, historically 1920 x 1080 has always been far ahead, but 1366 x 768 makes up second place with half the amount of 1920 x 1080 hits – yet in the last 90 days, it’s not even top 7 so there must be a lot of monitor or laptop upgrades recently :)
I hope those stats gave you some insights into both what msportals.io sees, and also very easily what any site can learn about it’s visitors – this is using Google Analytics, without any costs involved.